ASURLABS COMMUNITY

Market Forum

Public read-only access. Sign in with an eligible membership to comment.

Sign in
Community intelligence23 published discussions
Breakout or Fakeout?
Pinned discussionMarket Discussion

Breakout or Fakeout?

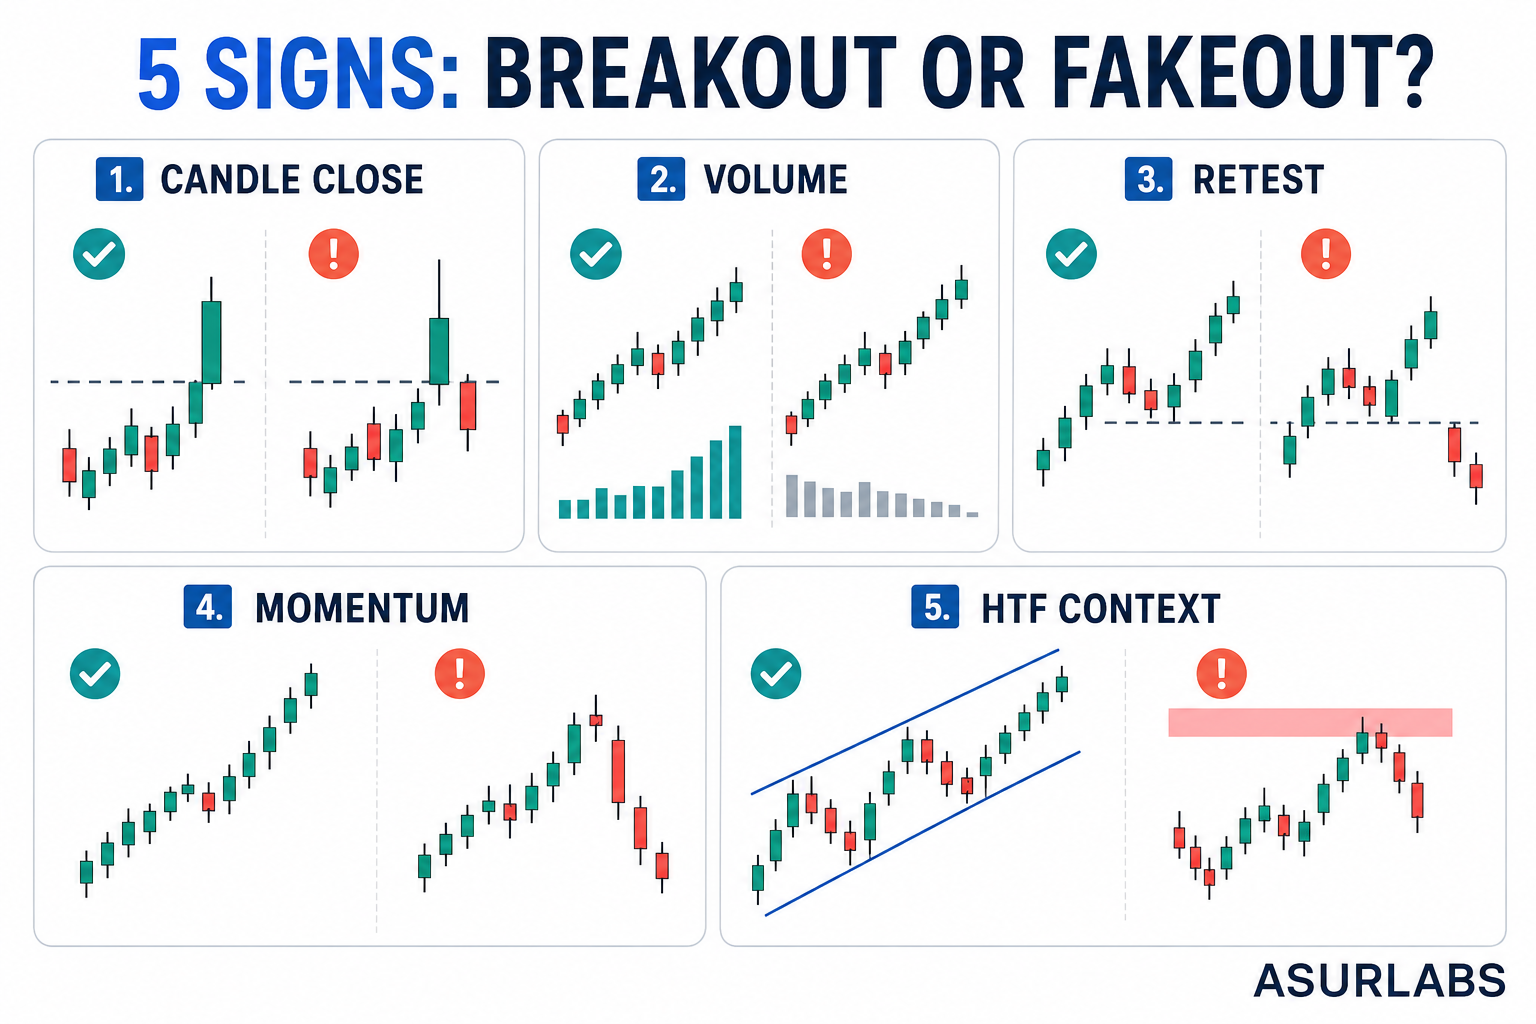
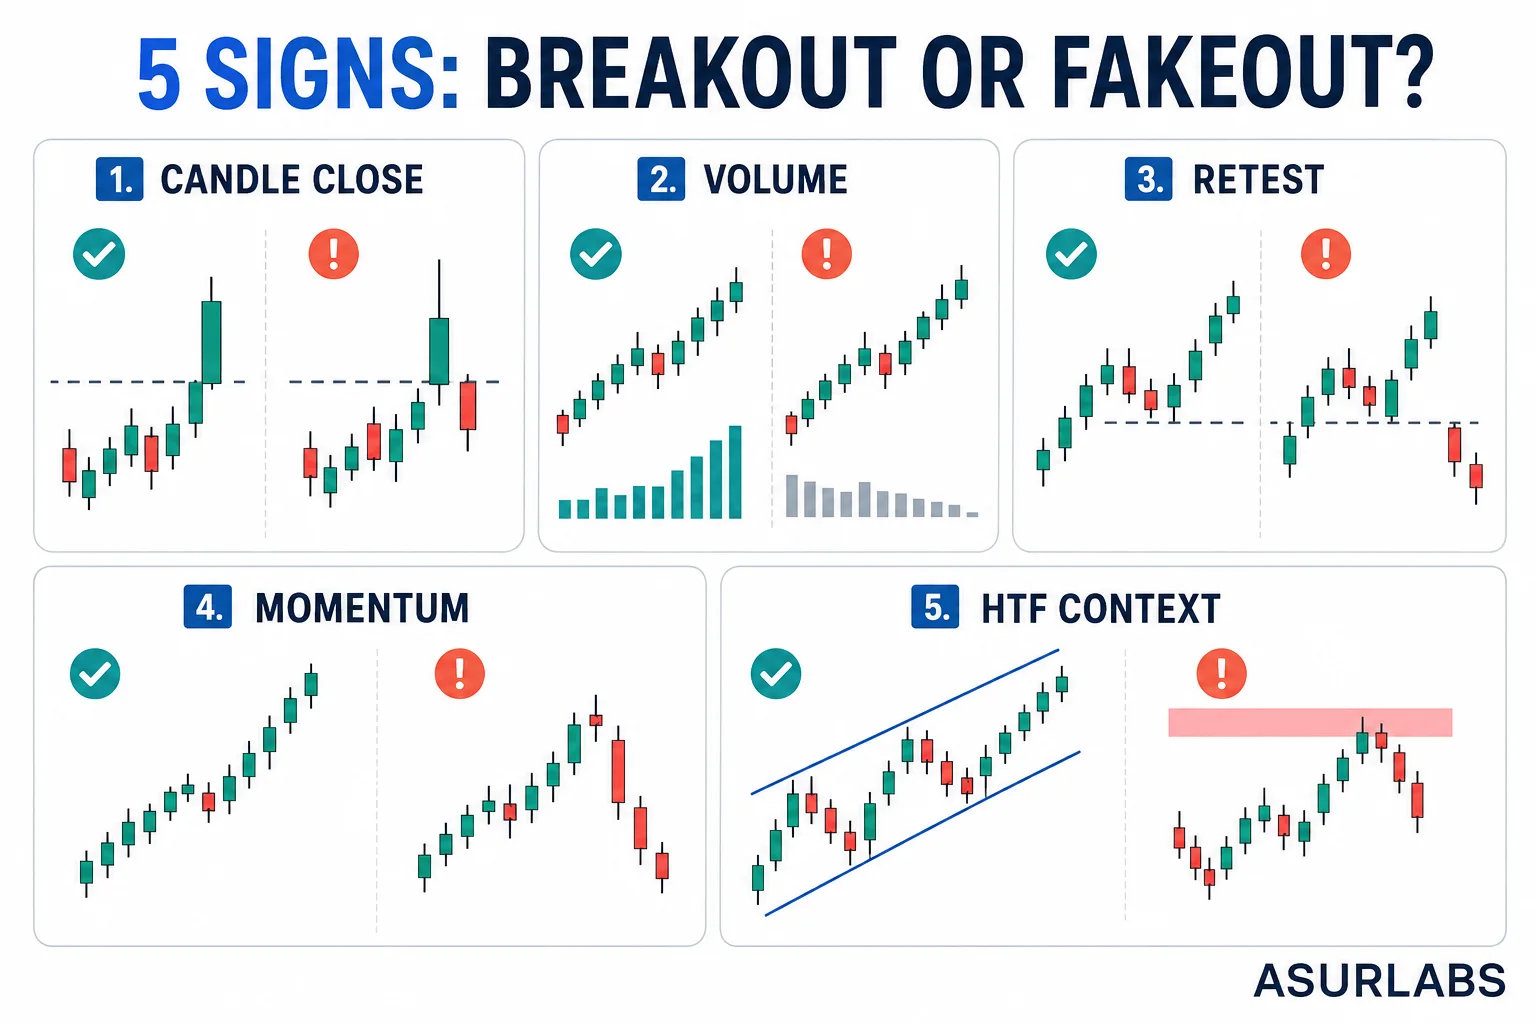
Breakout or Fakeout? 5 Important Signals Every Trader Should Check Breakout trading can offer excellent opportunities—but not every move beyond support or resistance is a genuine breakout. Sometimes price crosses a key level, attracts traders into the market, and then quickly reverses. This is commonly known as a fakeout or false breakout . Although no method can identify every fakeout with certainty, the following five signals can help traders evaluate whether a breakout has genuine strength or is more likely to fail. 1. Check the Candle Close—not Just the Wick A candle wick moving beyond support or resistance is not always a confirmed breakout. Price may briefly cross the level because of volatility, liquidity collection, a stop hunt, or temporary market pressure. If the candle closes back inside the previous range, the breakout may be weak or false. A stronger breakout generally shows: A decisive candle-body close beyond the key level A reasonably strong candle body Limited rejection from the breakout area The candle closing near its high in a bullish breakout The candle closing near its low in a bearish breakout Example If price moves above resistance but closes below it, buyers have failed to maintain control. However, if the candle body closes clearly above resistance, the breakout has stronger initial confirmation. Key principle: A wick shows that price visited a level; a candle close shows where the market accepted price. 2. Look for Volume Expansion Volume can provide useful information about the strength behind a breakout. A genuine breakout is often supported by increased market participation. If price crosses an important level while volume remains weak, the move may lack sufficient commitment to continue. Look for: Higher volume compared with recent candles Increasing activity as price approaches the level Strong participation during the breakout candle Continued activity after the breakout A low-volume breakout does not automatically mean the move will fail. However, weak participation should encourage traders to wait for additional confirmation. Important Forex Note In decentralized forex markets, many platforms display tick volume , not total centralized market volume. Tick volume can still be useful for comparing relative activity on the same broker or data feed, but it should not be treated as a complete measurement of global forex volume. 3. Observe the Retest After breaking a key level, price often returns to test it from the opposite side. In a bullish breakout: Previous resistance may become support. In a bearish breakout: Previous support may become resistance. A successful retest may include: Price returning to the broken level Rejection from that level A confirmation candle forming in the breakout direction Price continuing away from the level A failed retest may occur when price moves back through the broken level and closes inside the previous range. This can indicate that the breakout was not accepted by the market. Not every valid breakout produces a perfect retest. Some strong moves continue without returning to the level. Traders should therefore treat a retest as useful confirmation—not a mandatory condition in every market situation. 4. Evaluate Momentum and Follow-Through A genuine breakout normally needs momentum after crossing the level. The breakout becomes more convincing when the next candles continue in the same direction instead of immediately reversing. Positive signs include: Strong breakout candle Consecutive candles moving in the breakout direction Limited overlap between candles Higher highs and higher lows after a bullish breakout Lower highs and lower lows after a bearish breakout No immediate strong rejection candle Warning signs include: A long rejection wick A weak or indecisive breakout candle Immediate reversal after crossing the level Price repeatedly moving above and below the same level A strong engulfing candle against the breakout direction Momentum does not guarantee continuation, but a breakout without follow-through deserves additional caution. 5. Confirm the Higher-Timeframe Context A breakout should not be analyzed in isolation. A setup may appear strong on a lower timeframe but move directly into a major higher-timeframe support, resistance, supply, or demand area. Before entering, check: The higher-timeframe trend Major support and resistance zones Previous swing highs and lows Market structure Nearby supply or demand areas Important session levels Scheduled high-impact economic events For example, an M5 bullish breakout may have limited potential if price is approaching a major H1 or H4 resistance zone. A breakout aligned with the higher-timeframe structure generally has better contextual support than one moving directly against it. Quick Breakout Confirmation Checklist Before considering a breakout trade, ask: ✅ Did the candle body close clearly beyond the level? ✅ Was there meaningful volume or market participation? ✅ Did price successfully retest the broken level? ✅ Is there momentum and follow-through? ✅ Does the higher-timeframe structure support the move? ✅ Is there enough space before the next major opposing zone? ✅ Is the potential reward reasonable compared with the risk? ✅ Is high-impact news likely to create abnormal volatility? One signal alone is rarely enough. A stronger setup usually appears when several forms of confirmation align. Final Thoughts The objective is not to predict every breakout perfectly. The objective is to avoid reacting to every temporary move beyond a support or resistance level. Waiting for confirmation may occasionally result in a later entry or a missed trade. However, it can also reduce impulsive entries into weak breakouts. Always define your entry, stop-loss level, profit target, and acceptable risk before entering a trade. No breakout pattern or confirmation method can eliminate market uncertainty. Which signal helps you identify fakeouts most effectively—candle close, volume, retest, momentum, or higher-timeframe context? Share your experience in the ASURLABS Forum. Educational content only. This material does not constitute financial or investment advice. Trading involves substantial risk, and losses may exceed expectations. ASURLABS ForexEducation BreakoutTrading Fakeout PriceAction TechnicalAnalysis RiskManagement

By Paul · 22 Aug 2026 · 0 comments
Read discussion
Why Do Traders Lose Money Even With a Good Trading Strategy?
Trading Psychology & Risk Management

Why Do Traders Lose Money Even With a Good Trading Strategy?

Why Do Traders Lose Money Even With a Good Trading Strategy? A lot of traders spend months searching for the “perfect” strategy. They test indicators. They backtest setups. They change timeframes. They search for better entry signals. But here is the uncomfortable question: If the strategy is actually good, why do so many traders still lose money? Maybe the problem isn't always the strategy. Sometimes, the real problem is how the strategy is being used. 1. Risking Too Much on One Trade Imagine a trader has a $1,000 account and risks $100 on every trade. That's 10% risk per trade. A few consecutive losses can create a serious drawdown, and recovering from a large drawdown becomes increasingly difficult. A trader can have a profitable strategy and still destroy an account through poor position sizing. Good strategy + bad risk management = dangerous combination. 2. Moving the Stop Loss This is one of the most common mistakes. A trader enters a position with a predefined Stop Loss. Price moves against the trade. Instead of accepting the planned loss, the trader moves the Stop Loss farther away. Then it happens again. Eventually, a small planned loss becomes a much larger one. The problem wasn't necessarily the entry. The problem was abandoning the original trading plan. 3. Revenge Trading You take a loss. Instead of stopping and reviewing the trade, you immediately open another position because you want to recover the money. That trade loses too. You increase the position size. Another loss follows. This cycle can turn one normal losing trade into a major account drawdown. A losing trade is part of trading. Revenge trading is a decision-making problem. 4. Overtrading More trades don't automatically mean more profits. Sometimes the best trading decision is simply: Do nothing. If your strategy gives you three high-quality setups today, taking ten additional trades just because the market is moving can reduce your overall performance. Quality matters more than quantity. 5. Changing Strategies Too Quickly Strategy A loses three trades. The trader immediately switches to Strategy B. Strategy B loses two trades. Now they move to Strategy C. After several months, they have tested ten different strategies but have properly mastered none of them. Every strategy experiences losing periods. Before abandoning a system, ask: Did I follow the rules? Was the setup valid? Was the sample size large enough? Was the loss within my planned risk? Did market conditions change? The Bigger Problem: Psychology Trading is not just about finding entries. It's also about controlling your decisions when money is involved. Fear can make traders exit too early. Greed can make traders hold too long. FOMO can make traders enter late. Overconfidence can make traders increase position size. Frustration can lead to revenge trading. That's why two traders can use the same strategy and get completely different results. What Actually Makes a Trading System Strong? A complete trading system should define more than just an entry signal. It should include: Entry Rules When exactly should you enter? Stop Loss Rules Where is the trade idea considered invalid? Take Profit Rules Where and how will you take profit? Position Sizing How much are you willing to risk? Maximum Daily Loss When should you stop trading for the day? Trading Conditions When should you NOT trade? Review Process How will you measure your performance? A Simple Rule Worth Remembering Before entering a trade, don't ask only: “How much can I make?” Ask: “How much can I lose, and am I comfortable accepting that loss?” That single change in mindset can completely change how you approach the market. 💬 Community Discussion I want to hear from experienced and beginner traders in the ASURLABS community: What do you think is the 1 reason traders fail? A) Poor Risk Management B) Trading Psychology C) Overtrading D) No Proper Strategy E) Lack of Discipline F) Something else Comment your answer and explain why... Let's make this thread useful for both beginners and experienced traders. Disclaimer: This discussion is for educational purposes only and should not be considered financial advice. Trading financial markets involves significant risk. Always conduct your own research and use appropriate risk management.

By UMH · 18 Aug 2026 · 0 commentsRead discussion
Why Do Traders Lose Money Even With a Good Trading Strategy?
Trading Psychology & Risk Management

Why Do Traders Lose Money Even With a Good Trading Strategy?

Why Do Traders Lose Money Even With a Good Trading Strategy? A lot of traders spend months searching for the “perfect” strategy. They test indicators. They backtest setups. They change timeframes. They search for better entry signals. But here is the uncomfortable question: If the strategy is actually good, why do so many traders still lose money? Maybe the problem isn't always the strategy. Sometimes, the real problem is how the strategy is being used. 1. Risking Too Much on One Trade Imagine a trader has a $1,000 account and risks $100 on every trade. That's 10% risk per trade. A few consecutive losses can create a serious drawdown, and recovering from a large drawdown becomes increasingly difficult. A trader can have a profitable strategy and still destroy an account through poor position sizing. Good strategy + bad risk management = dangerous combination. 2. Moving the Stop Loss This is one of the most common mistakes. A trader enters a position with a predefined Stop Loss. Price moves against the trade. Instead of accepting the planned loss, the trader moves the Stop Loss farther away. Then it happens again. Eventually, a small planned loss becomes a much larger one. The problem wasn't necessarily the entry. The problem was abandoning the original trading plan. 3. Revenge Trading You take a loss. Instead of stopping and reviewing the trade, you immediately open another position because you want to recover the money. That trade loses too. You increase the position size. Another loss follows. This cycle can turn one normal losing trade into a major account drawdown. A losing trade is part of trading. Revenge trading is a decision-making problem. 4. Overtrading More trades don't automatically mean more profits. Sometimes the best trading decision is simply: Do nothing. If your strategy gives you three high-quality setups today, taking ten additional trades just because the market is moving can reduce your overall performance. Quality matters more than quantity. 5. Changing Strategies Too Quickly Strategy A loses three trades. The trader immediately switches to Strategy B. Strategy B loses two trades. Now they move to Strategy C. After several months, they have tested ten different strategies but have properly mastered none of them. Every strategy experiences losing periods. Before abandoning a system, ask: Did I follow the rules? Was the setup valid? Was the sample size large enough? Was the loss within my planned risk? Did market conditions change? The Bigger Problem: Psychology Trading is not just about finding entries. It's also about controlling your decisions when money is involved. Fear can make traders exit too early. Greed can make traders hold too long. FOMO can make traders enter late. Overconfidence can make traders increase position size. Frustration can lead to revenge trading. That's why two traders can use the same strategy and get completely different results. What Actually Makes a Trading System Strong? A complete trading system should define more than just an entry signal. It should include: Entry Rules When exactly should you enter? Stop Loss Rules Where is the trade idea considered invalid? Take Profit Rules Where and how will you take profit? Position Sizing How much are you willing to risk? Maximum Daily Loss When should you stop trading for the day? Trading Conditions When should you NOT trade? Review Process How will you measure your performance? A Simple Rule Worth Remembering Before entering a trade, don't ask only: “How much can I make?” Ask: “How much can I lose, and am I comfortable accepting that loss?” That single change in mindset can completely change how you approach the market. 💬 Community Discussion I want to hear from experienced and beginner traders in the ASURLABS community: What do you think is the 1 reason traders fail? A) Poor Risk Management B) Trading Psychology C) Overtrading D) No Proper Strategy E) Lack of Discipline F) Something else Comment your answer and explain why... Let's make this thread useful for both beginners and experienced traders. Disclaimer: This discussion is for educational purposes only and should not be considered financial advice. Trading financial markets involves significant risk. Always conduct your own research and use appropriate risk management.

By UMH · 15 Aug 2026 · 0 commentsRead discussion
Position Sizing and Money Management
TRADING GUIDES

Position Sizing and Money Management

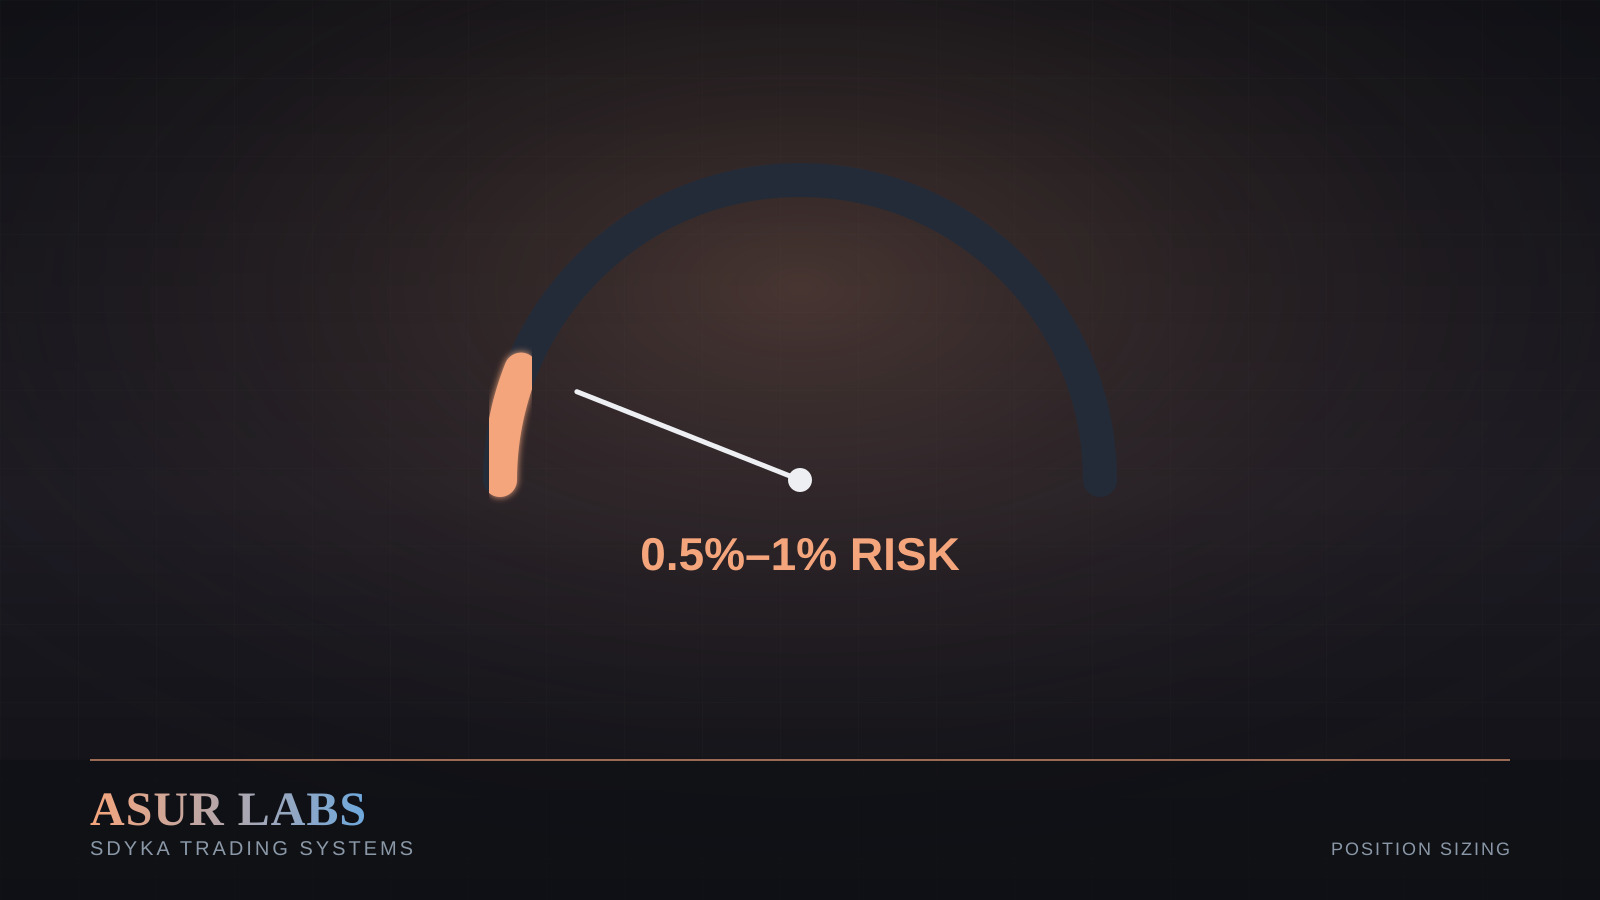
Position Sizing and Money Management The unglamorous math that determines whether you're still trading next year Position Size Should Come From Risk, Not Confidence A common mistake is sizing a position based on how confident you feel about a setup. Confidence has no place in position sizing — it should be calculated purely from your fixed risk percentage and your stop-loss distance, the same way every single time, regardless of how strong the setup looks. A Simple Position Sizing Formula Risk amount in dollars = Account balance × Risk percentage. Position size = Risk amount ÷ (Stop-loss distance in pips × pip value). Working through this calculation before every trade — rather than estimating — removes a major source of inconsistency between trades. Why This Matters More Than Win Rate A trader risking a consistent 1% per trade can withstand ten consecutive losses and still have roughly 90% of their account intact. A trader risking 10% per trade can be functionally wiped out by the same losing streak. Position sizing is what turns an imperfect strategy into a survivable one. The Asur Labs Approach: SDYKA signals are published with Entry, SL, and TP so you can run this exact calculation yourself before every trade — the discipline is yours to keep.

By UMH · 5 Aug 2026 · 0 commentsRead discussion
Building a Trading Plan That Works
TRADING GUIDES

Building a Trading Plan That Works

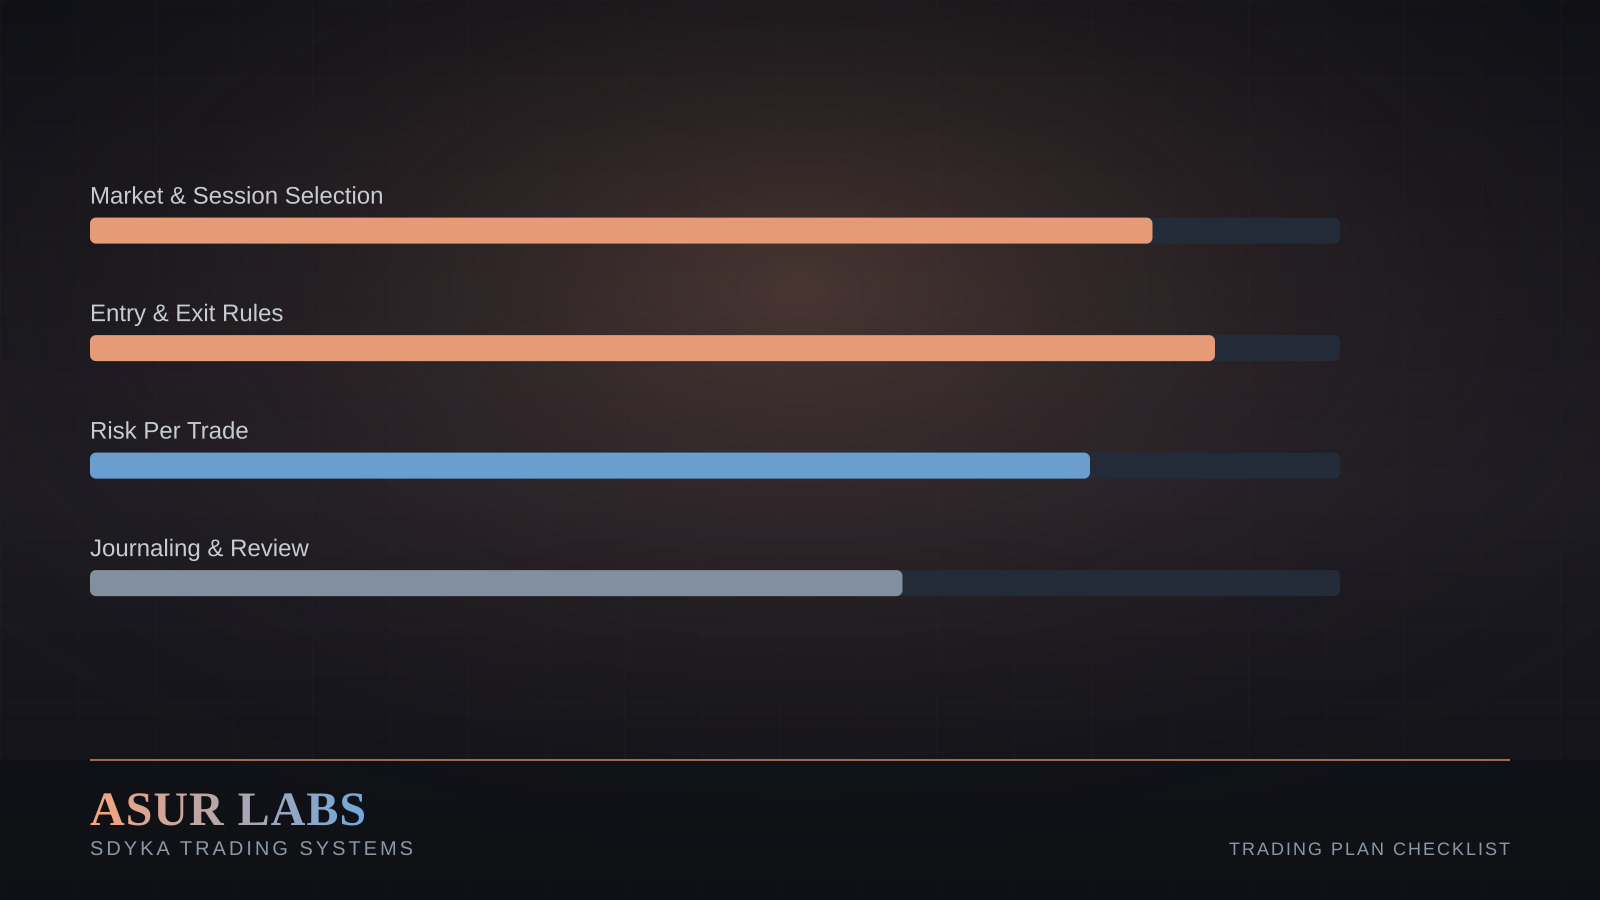
Building a Trading Plan That Works Turning scattered ideas into a repeatable, testable process Why 'I'll Just Wing It' Fails Without a written plan, every trading decision gets made in the moment, under pressure, often influenced by the emotion of the last trade. A trading plan removes as many in-the-moment decisions as possible by defining rules in advance, when you're calm and objective. The Core Components of a Trading Plan A workable trading plan doesn't need to be long — it needs to be specific enough that two different days of trading look consistent. • Market and session — which instruments and which trading hours you focus on • Setup criteria — the exact conditions that must be present before you consider an entry • Entry and exit rules — precise triggers, not vague impressions • Risk per trade — a fixed percentage, defined before entering • Review process — how and when you'll analyze completed trades Treat It as a Living Document A trading plan isn't fixed forever — but it should only be changed deliberately, based on reviewed data from your journal, never mid-trade based on a single emotional reaction. The Asur Labs Approach: Every SDYKA system — from 9/15 EMA Scalping to SIDDHIVINAYAKA 30 EMA — is itself a documented, rules-based plan, which is why results stay consistent across different traders using it.

By UMH · 5 Aug 2026 · 0 commentsRead discussion
How to Read Candlestick Patterns
TRADING GUIDES

How to Read Candlestick Patterns

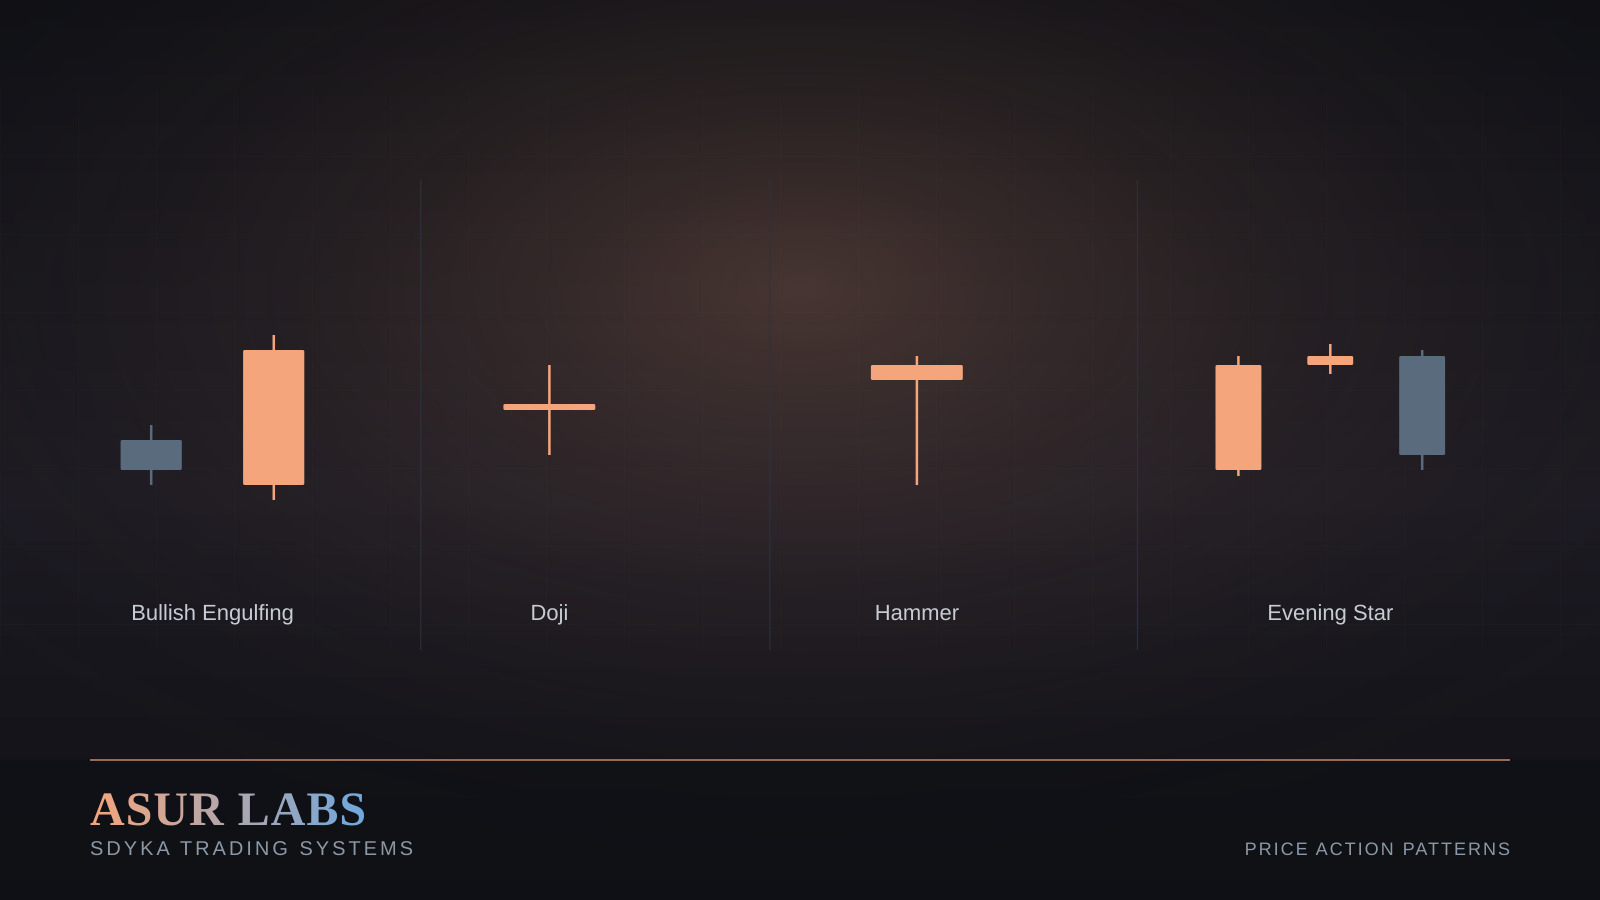
How to Read Candlestick Patterns The visual language of price action, decoded for practical use What a Single Candle Tells You Each candlestick shows four data points: open, high, low, and close for a given period. The body shows the range between open and close, while the wicks show the full range traded. A long body with short wicks signals strong conviction in one direction; long wicks with a small body signal rejection and indecision. Patterns Worth Knowing A small number of patterns account for most of the practical value in candlestick analysis. Depth of understanding matters more than memorizing dozens of rare formations. • Bullish/Bearish Engulfing — a strong reversal signal when a candle fully engulfs the prior candle's body, especially at a key level • Doji — indecision candle where open and close are nearly equal, often signaling a potential turning point after a strong move • Hammer / Shooting Star — long wick rejection candles that often mark exhaustion at support or resistance • Morning/Evening Star — a three-candle reversal sequence marking a shift in momentum Context Is Everything A candlestick pattern in the middle of a range carries far less weight than the same pattern forming at a key support or resistance level with confluence from other tools. Never trade a pattern in isolation — always ask where on the chart it's forming. The Asur Labs Approach: Candlestick confirmation is one layer of our multi-factor entry checklist, used alongside EMA structure and ADX — never as a standalone signal.

By UMH · 5 Aug 2026 · 0 commentsRead discussion
Central Bank Policies and Forex Markets
FOREX EDUCATION

Central Bank Policies and Forex Markets

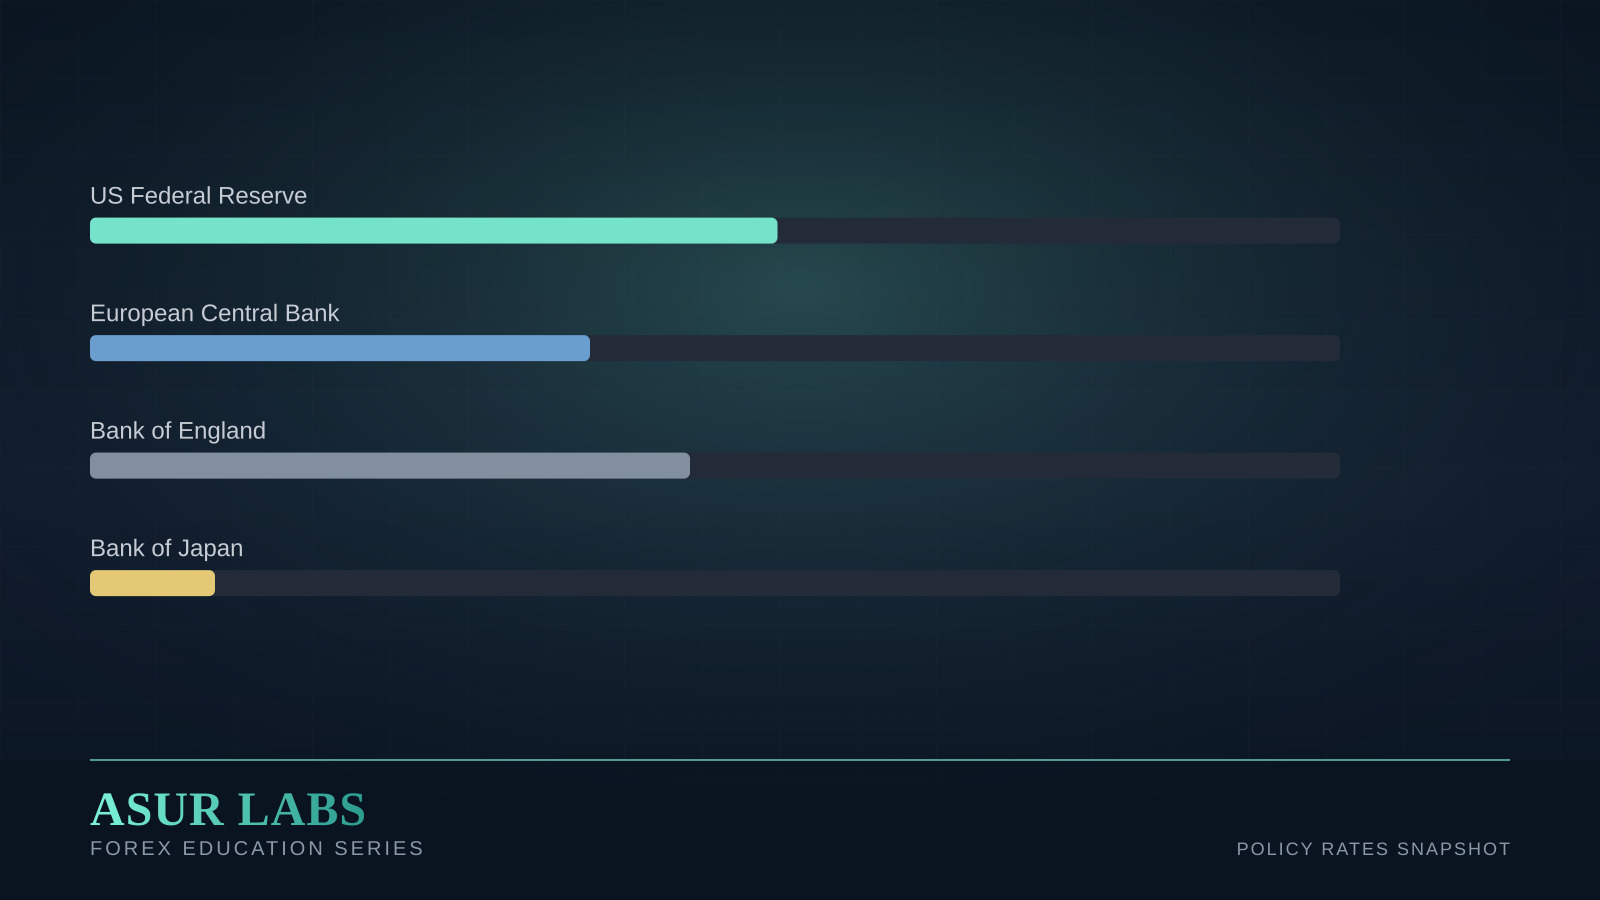
Central Bank Policies and Forex Markets How interest rate decisions from major banks set the tone for entire currencies Interest Rates as the Primary Lever Central banks influence their currency's value primarily through interest rate policy. Higher rates tend to attract foreign capital seeking better returns, which increases demand for that currency. Lower rates tend to have the opposite effect, often weakening the currency as capital seeks yield elsewhere. Forward Guidance Matters More Than the Decision As with gold, forex markets are forward-looking. A rate decision that matches expectations is often already priced in before it's announced. The real market-moving content is in the accompanying statement and press conference — whether the central bank signals further tightening, an extended pause, or the start of a cutting cycle. Tracking Multiple Central Banks at Once Since every pair involves two currencies, comparing the policy stance of both relevant central banks — not just one — gives a clearer picture of likely direction. A pair between a hawkish central bank and a dovish one tends to trend more persistently than a pair between two banks with similar stances. The Asur Labs Approach: SDYKA's HTF bias process weighs the relative policy stance of both currencies in a pair before any technical setup is considered.

By UMH · 5 Aug 2026 · 0 commentsRead discussion