
How to Read Candlestick Patterns
By UMH · Published 5 August 2026 · Updated 5 August 2026 · 2 min read
How to Read Candlestick Patterns
The visual language of price action, decoded for practical use
What a Single Candle Tells You
Each candlestick shows four data points: open, high, low, and close for a given period. The body shows the range between open and close, while the wicks show the full range traded. A long body with short wicks signals strong conviction in one direction; long wicks with a small body signal rejection and indecision.
Patterns Worth Knowing
A small number of patterns account for most of the practical value in candlestick analysis. Depth of understanding matters more than memorizing dozens of rare formations.
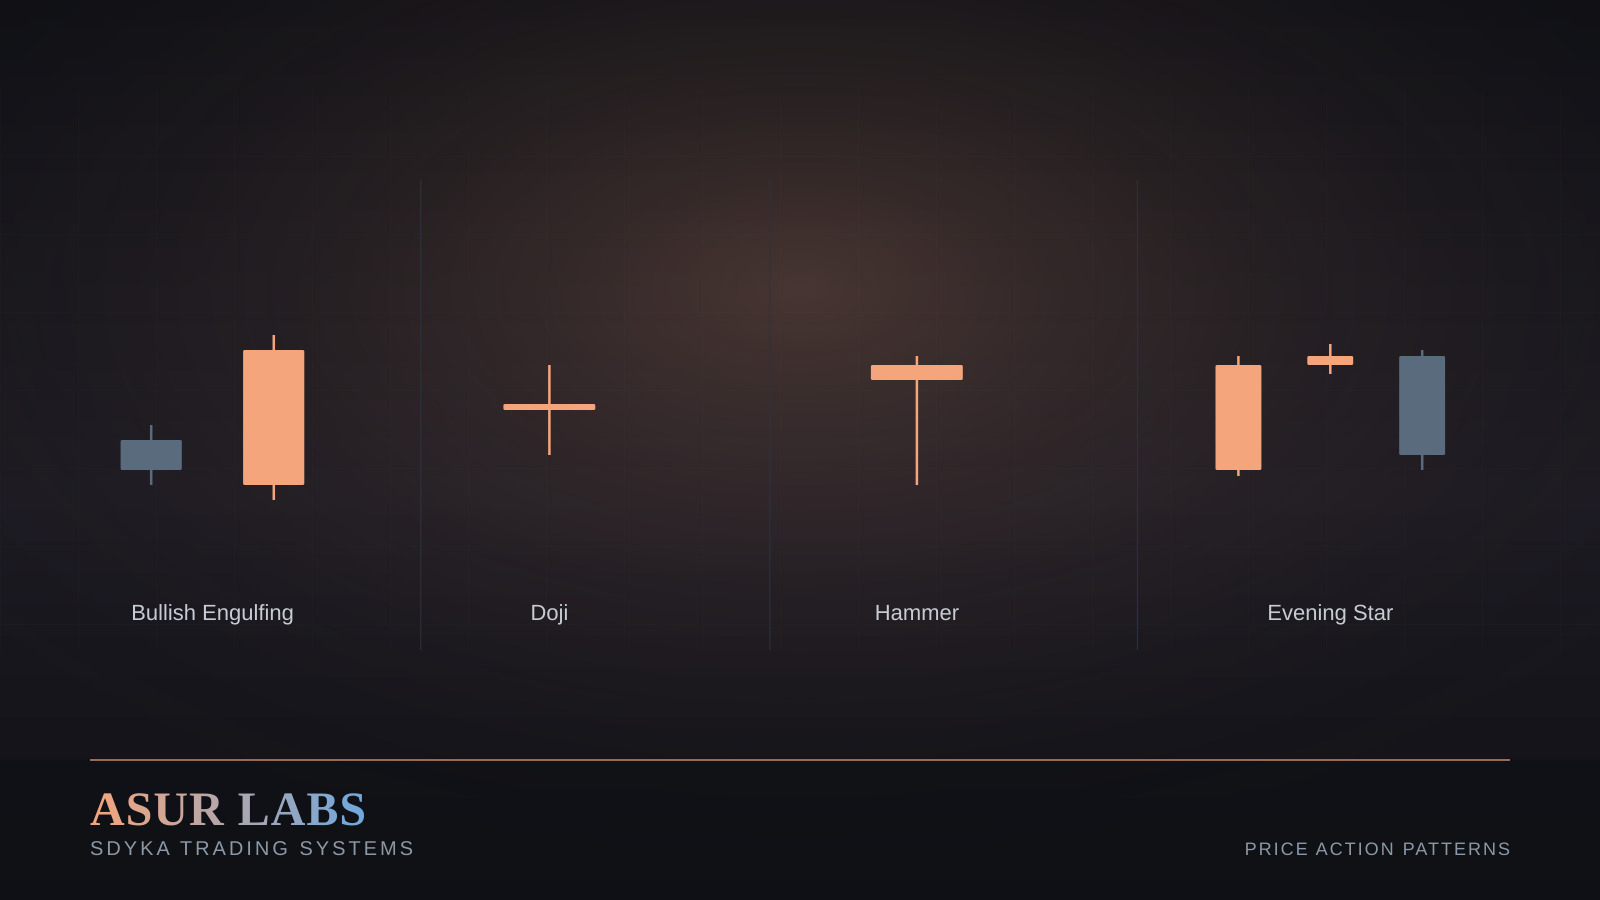
• Bullish/Bearish Engulfing — a strong reversal signal when a candle fully engulfs the prior candle's body, especially at a key level
• Doji — indecision candle where open and close are nearly equal, often signaling a potential turning point after a strong move
• Hammer / Shooting Star — long wick rejection candles that often mark exhaustion at support or resistance
• Morning/Evening Star — a three-candle reversal sequence marking a shift in momentum
Context Is Everything
A candlestick pattern in the middle of a range carries far less weight than the same pattern forming at a key support or resistance level with confluence from other tools. Never trade a pattern in isolation — always ask where on the chart it's forming.
The Asur Labs Approach: Candlestick confirmation is one layer of our multi-factor entry checklist, used alongside EMA structure and ADX — never as a standalone signal.
0 comments
Public reading. Respectful participation is available to eligible signed-in members.
Sign in with an eligible membership to comment. Likes and sharing remain public.
Log in to leave a verified review. Likes and sharing remain public.