
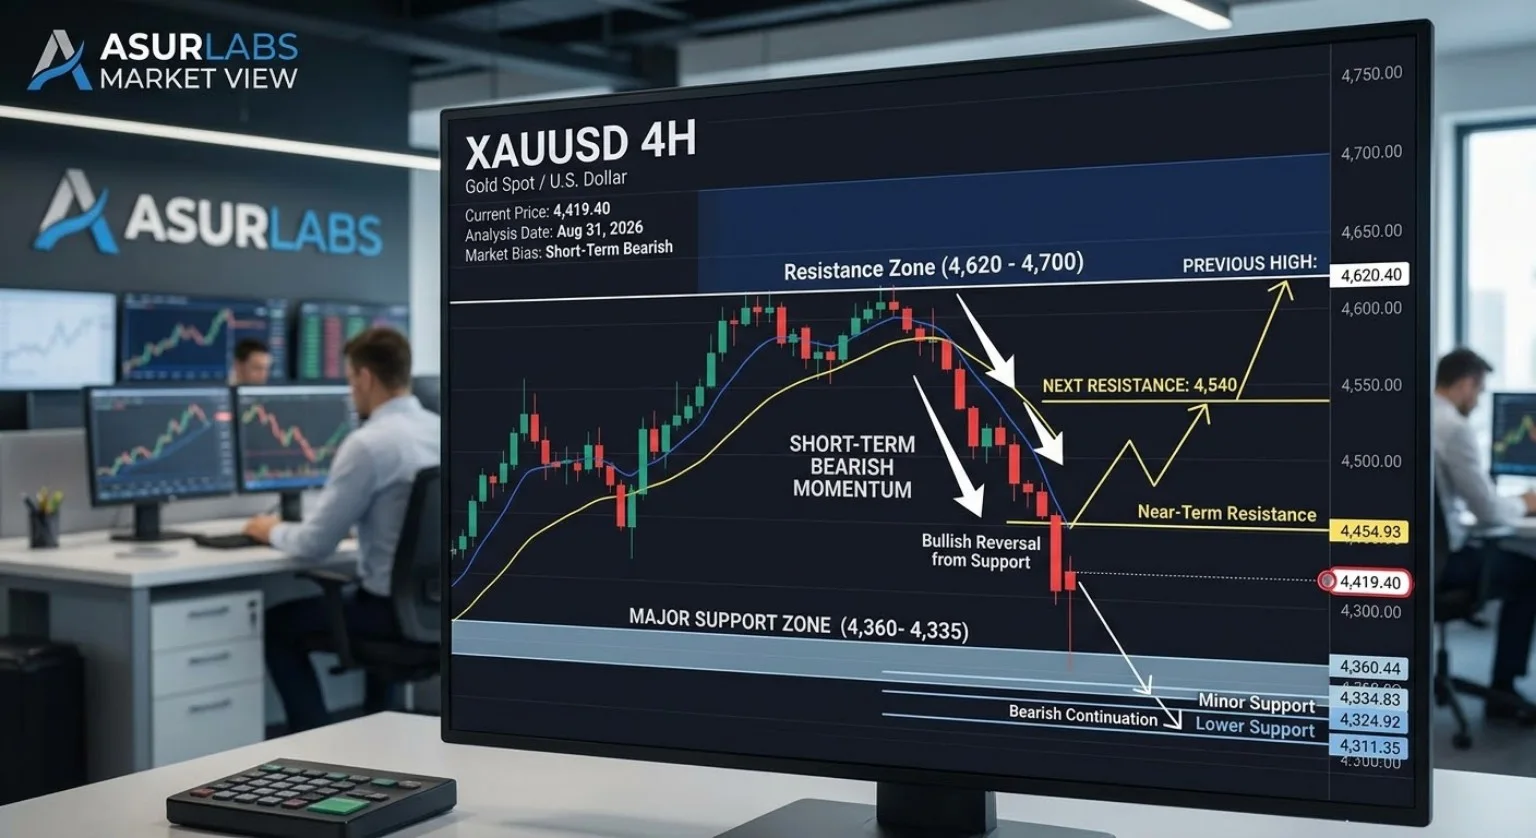
Market: Gold Spot / U.S. Dollar (XAUUSD)
Timeframe: 4 Hours
Current Price: 4,419.40
Market Bias: Short-Term Bearish
Analysis Date: August 31, 2026
Analysis Type: Technical & Market Structure Analysis
Market Overview
Gold (XAUUSD) is currently experiencing a strong bearish move on the 4-hour timeframe after failing to continue its previous upward movement.
Price previously advanced toward the 4,620–4,700 area, where the bullish momentum began to weaken. After several attempts to continue higher, the market started forming a more unstable structure around the highs. Sellers eventually gained control, resulting in the sharp decline visible on the latest candles.
At the time of this analysis, XAUUSD is trading around 4,419.40.
Although the short-term momentum is clearly bearish, price is now approaching an important support area. Because of this, the current decline should be monitored carefully rather than chasing the move after a large bearish candle.
The key area to watch is approximately 4,360–4,335.
Current Market Structure
The recent 4-hour structure can broadly be divided into four stages:
- Strong bullish advance from the lower price area.
- Continuation toward the 4,620–4,700 region.
- Consolidation and repeated rejection near the highs.
- Strong bearish reversal toward the previous support structure.
The latest selling pressure is considerably stronger than the smaller pullbacks seen during the earlier bullish move.
This indicates that sellers currently have control over the short-term price movement.
However, the presence of strong selling does not automatically mean that the entire higher-timeframe bullish structure has been permanently reversed.
The market is now approaching an area where buyers previously became active. The reaction from this region will provide important information about the next potential direction.
Key Resistance Levels
4,454.93
The first important resistance level is around 4,454.93.
Price is currently trading below this area after the recent sell-off.
If buyers manage to recover this level and establish price above it on the 4-hour timeframe, the immediate bearish pressure could begin to weaken.
A move above 4,455 would not automatically confirm a bullish trend reversal, but it would be an important early indication that buyers are beginning to regain control.
4,540
The next important resistance area is around 4,540.
If price successfully reclaims 4,455, this level could become the next area of interest.
A sustained move above 4,540 would further strengthen the recovery scenario.
4,620
The 4,620 region is considerably more significant because it is located near the previous high-area structure.
If gold eventually returns above this region, the recent bearish reversal would need to be reassessed.
Major Support Zone: 4,360–4,335
The most important area on the current chart is the support region between approximately 4,360 and 4,335.
The chart shows several nearby structural levels:
4,360.44
4,334.83
4,324.92
4,311.35
Instead of treating these as completely independent levels, it is more useful to consider the 4,360–4,335 region as a broader support area.
Markets do not always reverse at an exact price. Price can temporarily move through one level, test another level below it, and then reverse.
Therefore, the reaction of price across the entire zone is more important than whether one exact number holds.
Bullish Scenario
The bullish scenario becomes more interesting if gold reaches the 4,360–4,335 support zone and buyers begin to defend the area.
A stronger bullish setup would develop if the following sequence occurs:
Price enters the support zone → selling pressure decreases → buyers produce a meaningful reaction → a short-term higher low develops → price reclaims 4,455.
If this sequence develops, the market could potentially move toward:
4,455
4,540
4,620
However, simply touching 4,360 should not be considered a bullish confirmation.
A support level is an area of interest, not a guarantee of a reversal.
Confirmation from actual price behavior would provide a stronger basis for considering a recovery.
Bearish Scenario
The bearish continuation scenario becomes stronger if sellers successfully break the support structure.
A break below 4,360 would be the first warning.
However, the more important area is the broader 4,335–4,325 structure.
If price breaks below this area and remains below it on the 4-hour timeframe, the support structure would be considered significantly weakened.
The next marked support level would then be around 4,311.35.
A sustained move below 4,311 would indicate that sellers have gained further control and that the market may begin searching for lower support areas.
However, even after a breakdown, it is important to monitor whether price remains below the broken structure or quickly recovers above it.
Neutral Scenario
There is also a possibility that the market does not immediately choose either direction.
Gold could enter a consolidation phase between the support zone around 4,360–4,335 and resistance around 4,455.
In this situation, repeatedly entering trades in the middle of the range could provide a less favorable risk-to-reward opportunity.
Waiting for price to approach an important level and then observing the reaction may provide a clearer market structure.
What I Am Watching Now
The current chart can be simplified into two major areas:
Resistance: 4,455
Support: 4,360–4,335
As long as price remains below 4,455, short-term bearish pressure remains relevant.
However, because price is approaching major support, opening a new short position simply because the market is falling may carry additional risk.
The reaction around 4,360–4,335 is therefore more important to me than trying to predict the next candle.
Why Chasing the Current Sell-Off Can Be Risky
Large bearish candles can create a strong psychological temptation to enter short immediately.
However, when price has already moved significantly lower and is approaching an established support area, the potential risk-to-reward relationship can change.
A trader entering after an extended move may be selling much closer to potential support.
For that reason, patience is important.
Instead of asking whether gold will continue falling, a more useful question is:
How will gold behave when it reaches the 4,360–4,335 support zone?
A strong rejection, a change in short-term structure, or a successful reclaim of a broken level could provide more meaningful information than the current bearish candle alone.
Key Price Levels
Major Resistance: 4,620
Resistance: 4,540
Key Near-Term Resistance: 4,455
Current Price: 4,419.40
First Major Support: 4,360
Major Support: 4,335
Secondary Support: 4,325
Lower Support: 4,311
Scenario Summary
Bullish Scenario
If 4,360–4,335 holds and buyers establish a meaningful reaction, gold could attempt to recover toward 4,455.
A successful reclaim of 4,455 could open the possibility of a move toward 4,540 and potentially 4,620.
Bearish Scenario
If sellers break through 4,360 and subsequently establish price below 4,335–4,325, bearish continuation becomes more likely.
In that situation, 4,311 becomes the next important level visible on the current chart.
Neutral Scenario
If support holds but 4,455 continues to reject price, gold could remain inside a consolidation range while the market waits for a stronger catalyst.
What Would Invalidate the Short-Term Bearish View?
A sustained recovery above 4,455 would be the first major warning that the current bearish momentum is losing strength.
A stronger recovery above 4,540 would further weaken the immediate bearish interpretation.
If price eventually reclaims the 4,620 region, the recent bearish structure would need to be reassessed completely.
An invalidation level is important because technical analysis should not only describe what could happen. It should also explain what would prove the original idea wrong.
Risk Management
This analysis is based on the 4-hour chart and is intended for educational and informational purposes only.
Gold can experience significant volatility during major economic announcements, central-bank decisions, inflation data, employment reports and unexpected geopolitical developments.
Before taking any position, traders should consider their:
- Position size
- Account risk
- Stop-loss distance
- Risk-to-reward ratio
- Trading costs
- Market volatility
- Broker execution conditions
- Exposure during major economic news
No technical level can guarantee a reversal or continuation.
Proper risk management remains more important than being correct about an individual market direction.
ASURLABS Market View
Current 4H View: Cautiously Bearish
The short-term structure currently favors sellers following the strong decline from the 4,620–4,700 region.
However, price is approaching an important support structure around 4,360–4,335.
For that reason, I would not consider the current decline a guaranteed bearish continuation.
The next important information should come from the reaction around the support zone.
If buyers defend 4,360–4,335 and price eventually reclaims 4,455, a recovery toward 4,540 and potentially 4,620 could become possible.
If sellers instead break through 4,335–4,325 and maintain price below the area, the bearish continuation scenario becomes stronger, with 4,311 becoming the next important level.
At this stage, patience and confirmation are more important than trying to predict every short-term movement.
Final Takeaway
Gold is currently caught between strong short-term selling pressure and an important support structure.
The key levels from this analysis are:
Upside: 4,455 → 4,540 → 4,620
Downside: 4,360 → 4,335 → 4,325 → 4,311
The most important area to monitor is 4,360–4,335.
A strong reaction from this zone could provide the first indication of a potential recovery.
A confirmed breakdown through the zone could instead signal further bearish continuation.
The market does not have to follow either scenario.
Technical analysis is not about predicting every candle. It is about identifying important market areas, understanding possible scenarios, defining invalidation points and managing risk when the market behaves differently from expectations.
Risk Disclosure
ASURLABS provides market analysis and educational information for informational purposes only. This analysis does not constitute investment advice, financial advice, a recommendation, or an offer to buy or sell any financial instrument.
Trading leveraged financial products, including forex, CFDs and precious metals, involves substantial risk and may result in significant losses. Past market performance or previous price behavior does not guarantee future results.
Readers should conduct their own research and consider their financial circumstances, objectives and risk tolerance before making any trading decision.
ASURLABS does not guarantee the accuracy, completeness or future performance of any market analysis, price level, scenario or trading idea presented on this website.
Log in to leave a verified review. Likes and sharing remain public.