
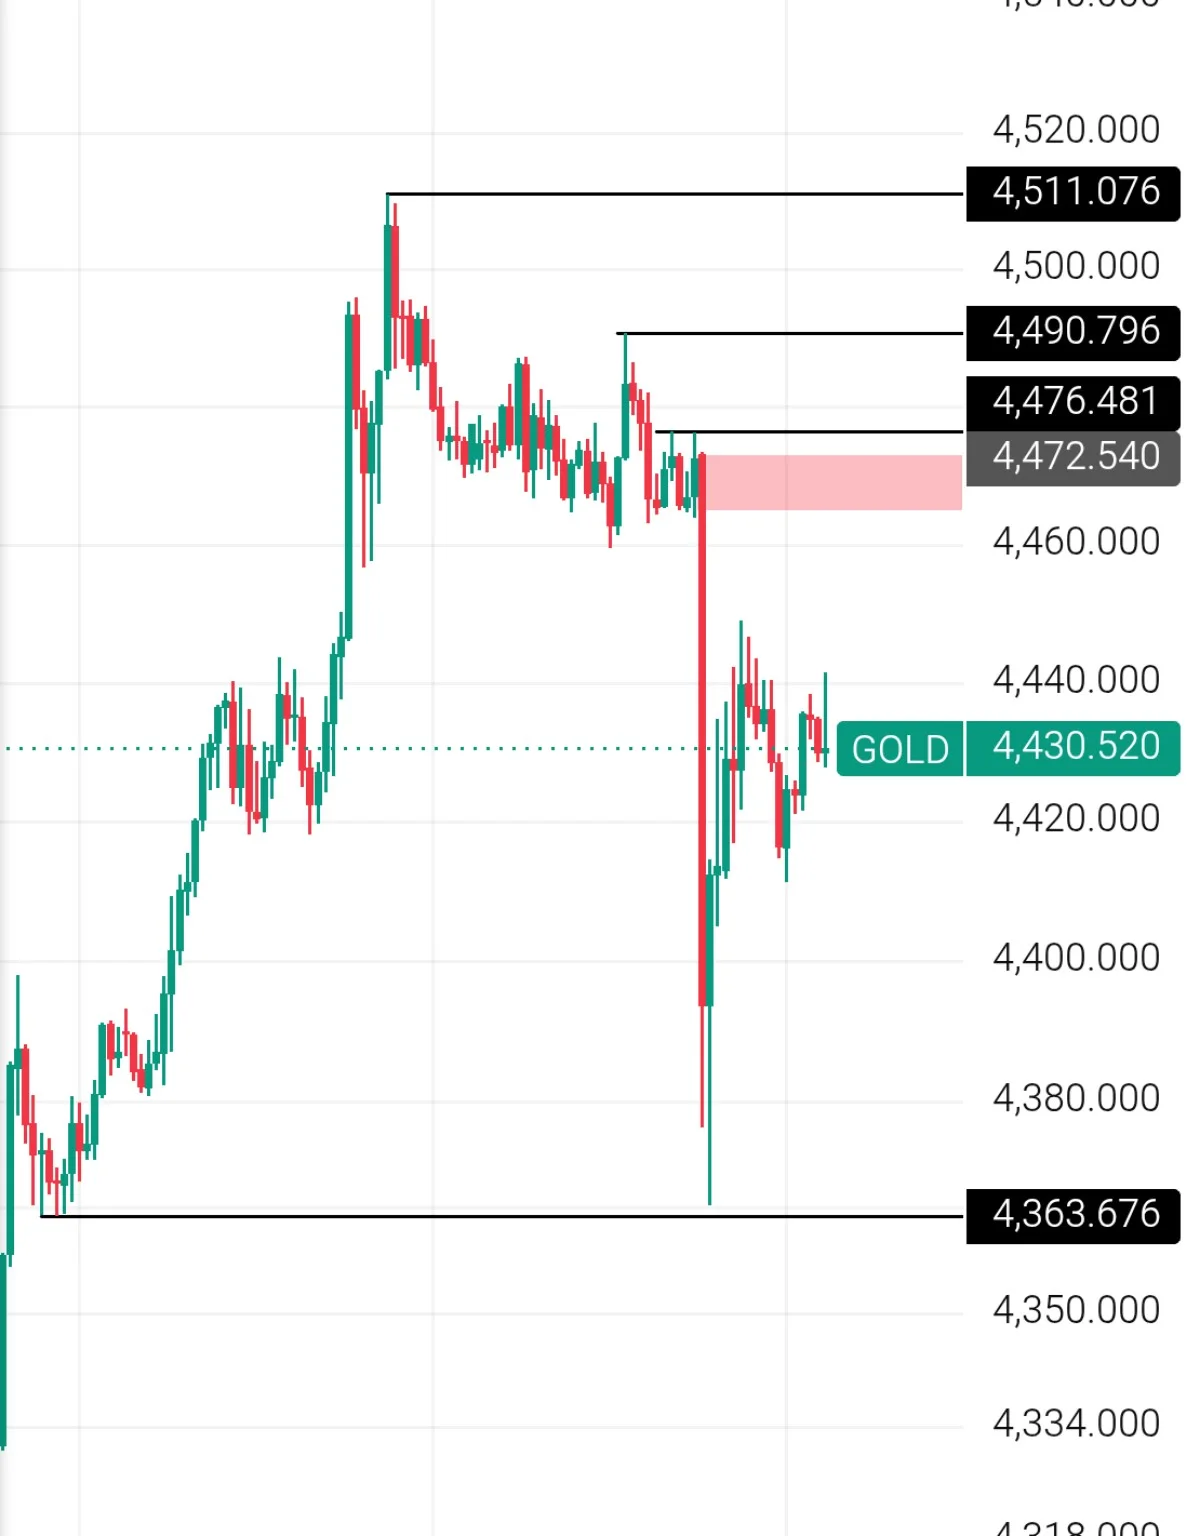
GOLD (XAUUSD) 30-Minute Analysis — Key Levels, Trade Setups & Scenarios
Timeframe: 30-Minute
Current Price: ~4,430.520
Market: Gold / XAUUSD
Gold is currently showing a high-volatility consolidation after a sharp bearish move. Price previously rejected the upper resistance area and then experienced a strong sell-off toward the 4,363.676 support region. After that decline, buyers stepped in and price has started stabilizing around the 4,420–4,440 area.
At the moment, the most important factor is whether Gold can reclaim the 4,472–4,476 resistance zone or whether sellers return before that area.
Important: This analysis is for educational and informational purposes only. It is not financial advice or a guarantee of future price movement. Always manage risk according to your own trading plan.
📊 Current Market Structure
The 30M chart currently shows three important phases:
1. Strong bullish advance
Gold previously climbed from the lower 4,360 area toward the 4,500+
region.
2. Distribution / consolidation near the top
Price struggled several times around the 4,470–4,490 region, indicating
strong selling interest.
3. Sharp bearish displacement
Gold eventually broke down aggressively from the consolidation area and reached
the 4,363.676 level.
After that sell-off, price recovered toward 4,430, but the recovery has not yet established a clear bullish reversal structure.
Therefore, the market is currently best treated as neutral-to-bearish until resistance is reclaimed.
🔴 Major Resistance Levels
Resistance 1: 4,472.540–4,476.481
This is the most important immediate resistance zone visible on the chart.
Price previously consolidated around this area before the major bearish breakdown.
If Gold returns here, traders should watch the 30M candle reaction carefully.
Resistance 2: 4,490.796
A sustained move above 4,476 could expose this level next.
This is an important breakout confirmation area because it represents the previous swing-high region.
Resistance 3: 4,511.076
This is the major visible swing-high resistance.
A strong 30M breakout and close above 4,490–4,511 would significantly weaken the current bearish structure.
🟢 Major Support
Support: 4,363.676
This is the major visible structural support on the chart.
The previous sell-off reached this area before buyers aggressively responded.
If Gold returns to this region, the reaction will be extremely important.
A decisive 30M breakdown below 4,363.676 would indicate that sellers have regained strong control.
🎯 PRIMARY TRADE SETUP — SELL THE RESISTANCE REJECTION
Preferred Sell Zone:
4,472–4,476
Do not sell simply because price touches the zone.
Wait for confirmation such as:
- 30M bearish rejection
- Bearish engulfing candle
- Strong rejection wick
- Failure to close above 4,476
- Lower-high formation
- Breakdown of the rejection candle's low
Example Entry
Sell: 4,470–4,476
Invalidation / SL: Above 4,491
TP1: 4,450
TP2: 4,430
TP3: 4,400
Extended target: 4,364
The setup becomes more attractive if price first moves into 4,472–4,476, rejects the zone, and then breaks the low of the confirmation candle.
Why this setup?
The 4,472–4,476 region sits directly around the previous consolidation/breakdown area. If sellers defend this zone again, it could act as resistance.
🟢 SECONDARY SETUP — BULLISH BREAKOUT
A bullish trade becomes more interesting only if Gold can reclaim the resistance structure.
Bullish Confirmation:
Wait for a 30M candle to close convincingly above 4,476.
Then ideally:
Breakout → Pullback → Retest → Bullish confirmation
Potential Entry:
4,476–4,482 after successful retest
Risk Level:
A protective stop can be placed below the retest structure rather than entering blindly during the breakout.
Targets:
TP1: 4,490.796
TP2: 4,511.076
Extended: 4,520+
The key point is that 4,476 must turn from resistance into support.
If Gold breaks above the level but immediately falls back below it, the breakout should be treated cautiously.
🟡 CURRENT PRICE AREA — 4,430
At approximately 4,430, Gold is sitting between major resistance and major support.
This is therefore not the cleanest location for a large directional entry.
Instead of chasing price in the middle of the range, traders can wait for price to reach a more meaningful decision area.
Above current price:
4,472–4,476 → immediate resistance
Below current price:
4,400 → psychological/structural area
4,363.676 → major support
This creates a much clearer risk-management framework.
📉 Bearish Scenario
If Gold moves upward toward 4,472–4,476 and gets rejected:
4,472–4,476 rejection
↓
4,450
↓
4,430
↓
4,400
↓
4,363.676
A clean break below 4,363.676 could open the possibility of further downside, but that would require fresh confirmation rather than assuming the move will continue.
📈 Bullish Scenario
If Gold instead produces a strong 30M close above 4,476:
4,476 breakout
↓
Successful retest
↓
4,490.796
↓
4,511.076
A sustained move above 4,511.076 would provide stronger evidence that the broader bearish structure has been invalidated.
⚠️ Important No-Trade Zone
The area around 4,425–4,445 is currently less attractive for a directional trade because price is sitting between major decision levels.
Entering in the middle of a range can create an unfavorable risk-to-reward profile.
A more disciplined approach is to wait for either:
Resistance reaction → bearish setup
or
Resistance breakout + retest → bullish setup
🧭 Trade Decision Map
|
Price Area |
Market Interpretation |
Action |
|
Above 4,511 |
Strong bullish confirmation |
Look for continuation/retest |
|
4,491–4,511 |
Major resistance |
Watch price reaction |
|
4,472–4,476 |
Immediate resistance zone |
Primary sell-watch area |
|
4,450–4,470 |
Transition area |
Wait for confirmation |
|
4,425–4,445 |
Current consolidation |
Avoid chasing |
|
4,400–4,420 |
Lower support area |
Watch for reaction |
|
4,363.676 |
Major support |
Key bullish reaction zone |
|
Below 4,363.676 |
Bearish structural breakdown |
Reassess for downside continuation |
💡 Best Risk-Management Approach
For this setup, the most important principle is confirmation before entry.
Instead of:
"Price reached resistance → immediately sell."
A higher-quality process is:
Resistance reached → rejection → 30M confirmation → entry → predefined SL → predefined TP
Likewise for the bullish side:
Resistance broken → 30M close above → retest → bullish confirmation → entry
This helps reduce the risk of entering during a false breakout.
For risk management, consider keeping the amount at risk on a single trade small and consistent. Avoid increasing position size simply because a setup looks particularly attractive.
🔎 Key Levels to Watch
🔴 SELL WATCH
4,472–4,476
Confirmation required.
🟢 BREAKOUT WATCH
Above 4,476
Prefer a 30M close + successful retest.
🎯 UPSIDE TARGETS
4,490.796 → 4,511.076
🔻 DOWNSIDE TARGETS
4,450 → 4,430 → 4,400 → 4,363.676
🛑 MAJOR INVALIDATION AREA
Above 4,490–4,511, depending on the exact bearish setup and entry.
Final Outlook
Current bias: Neutral-to-Bearish
Gold has already experienced a significant downward displacement, so chasing a fresh short around 4,430 is less attractive than waiting for a better location.
The 4,472–4,476 zone is the key decision area.
A rejection from this region could create a short opportunity toward 4,450 → 4,430 → 4,400 → 4,363.676.
On the other hand, a strong 30M close above 4,476, followed by a successful retest, could shift the short-term structure toward 4,490.796 and 4,511.076.
The best trade is therefore not necessarily the first move — it is the confirmed move from the key level.
ASURLABS — Market Analysis
Trade the structure. Manage the risk. Let confirmation decide the entry.
Log in to leave a verified review. Likes and sharing remain public.