
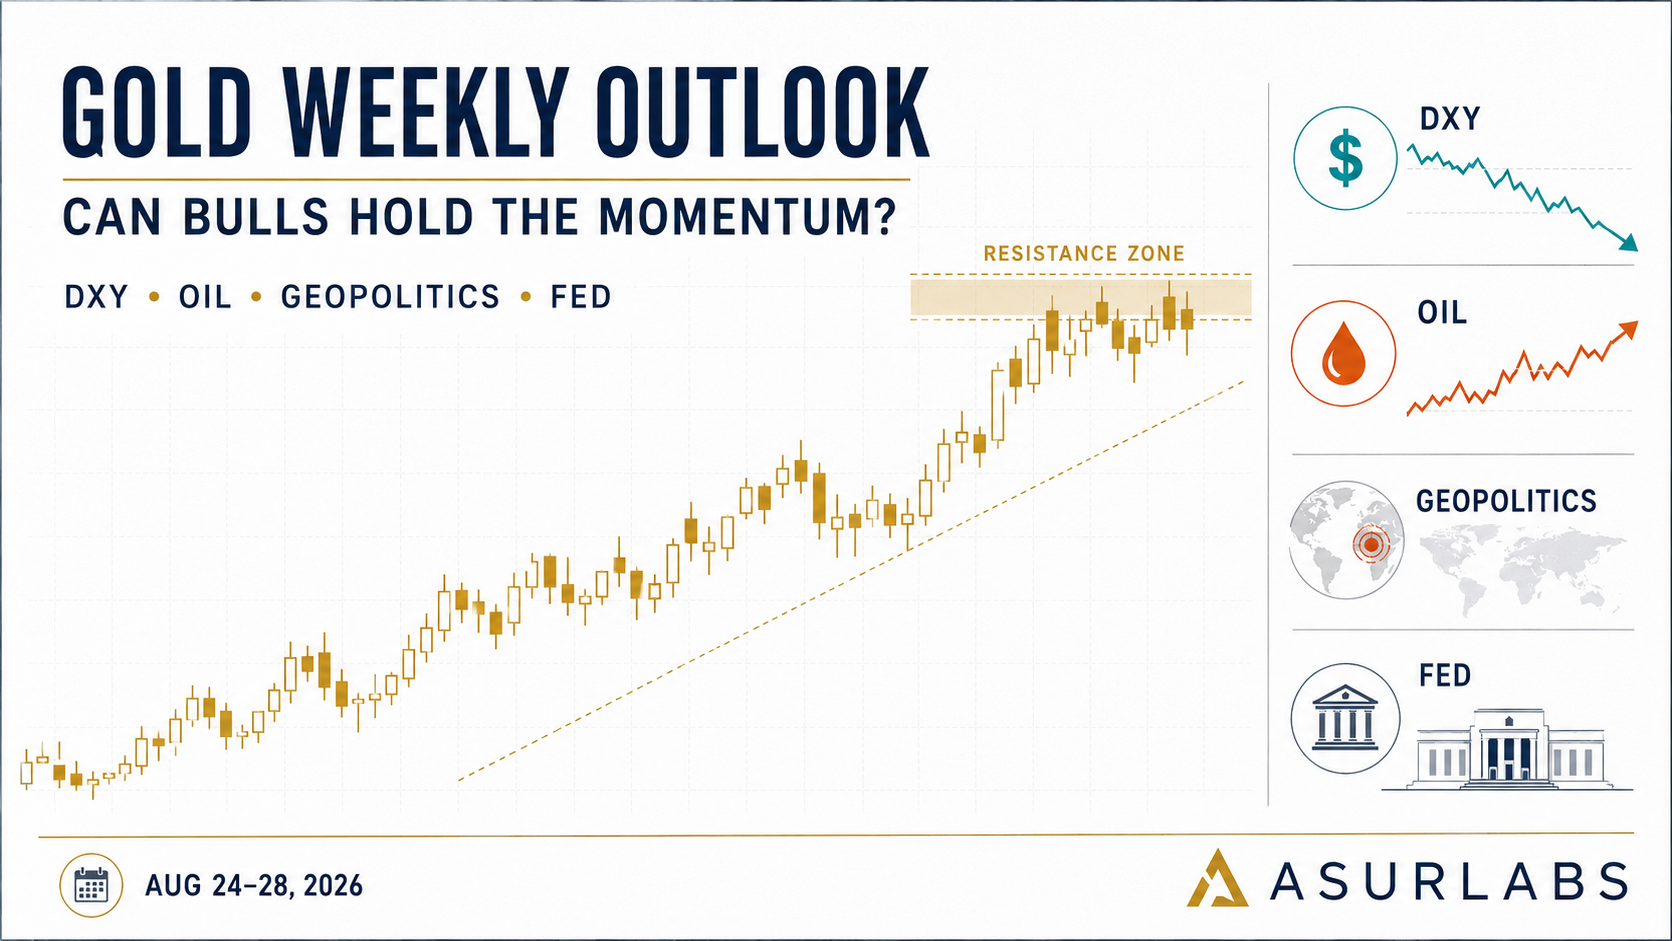
Gold Weekly Outlook: Can Bulls Extend the Rally as DXY Weakens and Oil Risk Rises?
Market Outlook: August 24–28, 2026
Gold enters the new trading week with powerful bullish momentum, but the next phase may be far more volatile than the previous one.
Spot gold ended Friday near $4,623.94, after reaching approximately $4,631.99, its highest level in more than three months. The metal gained more than 5% during the week and completed a third consecutive weekly advance. More importantly, the price moved above its closely watched 200-day moving average near $4,513, strengthening the broader technical structure. Reuters
The current rally is being supported by several forces at the same time:
• A weaker U.S. dollar
• Concerns surrounding the U.S. Treasury market
• Reduced confidence in further aggressive rate increases
• Rising geopolitical and energy-market risks
• Strong technical momentum and speculative demand
However, gold is now entering a major resistance area while next week contains important inflation data and central-bank communication. The bullish structure remains intact, but chasing price without confirmation could be dangerous.
Why Has Gold Become So Bullish?
1. The U.S. Dollar Has Weakened
The U.S. Dollar Index ended Friday around 98.80, while the dollar traded near a three-month low against the euro.
The decline followed concerns about the U.S. Treasury’s decision to increase purchases of longer-dated government securities. Some investors fear that efforts to control instability in the bond market may shift pressure toward the dollar.
A weaker dollar generally makes dollar-denominated gold relatively more attractive to international buyers. It can also increase demand for gold as an alternative store of value.
The U.S. Treasury officially announced that it would at least double the maximum size of liquidity-support buybacks in the 10-to-30-year maturity sectors, increasing the limit from $2 billion to at least $4 billion per operation. U.S. Treasury
As long as the DXY remains under pressure, gold may continue receiving macroeconomic support. A sharp DXY recovery, however, would become one of the clearest warning signals for gold buyers.
2. Gold Has Broken an Important Technical Barrier
Gold’s move above the 200-day moving average near $4,513 is technically significant.
Price is now trading above its major moving averages, while the latest weekly structure shows strong upward momentum. The recent high near $4,632 becomes the first short-term barrier, followed by the psychologically important $4,700 region.
Reuters reported that TD Securities identified approximately $4,700 as the next potential objective if the current momentum continues. This is an analyst assessment, not a guaranteed target. Reuters
The technical picture remains bullish while price holds above the breakout structure. However, the speed of the rally also raises the possibility of profit-taking, liquidity sweeps and deeper intraday pullbacks.
3. Oil and Geopolitical Risk Are Supporting Safe-Haven Demand
Energy prices also strengthened significantly during the week.
Brent crude settled near $94.39 per barrel, while WTI closed around $87.06. Brent gained approximately 6.39% over the week and WTI gained around 5.66%.
The move followed renewed tension between the United States and Iran, restricted Middle Eastern supply and reduced shipping activity through the Strait of Hormuz. Ukraine’s reported strike on a Russian oil refinery added another layer of supply uncertainty. Reuters
Geopolitical instability can support gold through safe-haven demand. However, rising oil prices create a more complicated situation.
Higher oil prices can affect gold in two opposite ways:
Bullish effect
• Greater geopolitical uncertainty
• Higher demand for defensive assets
• Stronger inflation-hedging demand
• Concerns about global energy supply
Potentially bearish effect
• Higher oil prices may increase inflation pressure
• Persistent inflation may keep interest rates elevated
• Higher yields may reduce the appeal of non-yielding gold
• A more hawkish Federal Reserve could support the dollar
Therefore, traders should not assume that higher oil prices will automatically push gold higher. The reaction of the dollar and Treasury yields will remain critical.
The Most Important Events Next Week
Wednesday, August 26 — 6:30 PM Bangladesh Time
The United States will release:
• Second estimate of Q2 GDP
• July Personal Income and Outlays
• Headline PCE inflation
• Core PCE inflation
Both reports are officially scheduled for August 26 at 8:30 AM Eastern Time, equivalent to approximately 6:30 PM Bangladesh time. U.S. Bureau of Economic Analysis
PCE is especially important because it is a key inflation measure monitored by the Federal Reserve.
Softer-than-expected PCE:
• Could weaken the dollar
• Could reduce rate-hike expectations
• Would generally support gold
Hotter-than-expected PCE:
• Could strengthen the dollar and Treasury yields
• Could revive expectations of tighter monetary policy
• May trigger profit-taking in gold
Because GDP and PCE will be released at the same time, the initial market reaction could be highly volatile and may reverse after the first move.
Thursday–Saturday, August 27–29 — Jackson Hole Symposium
The 2026 Jackson Hole Economic Policy Symposium will take place from August 27 to August 29. The official theme is “Financial Innovation: Implications for Payments and Policy.” Federal Reserve Bank of Kansas City
Federal Reserve Chairman Kevin Warsh is scheduled to deliver keynote remarks on Friday, August 28, at 10:00 AM Eastern Time—approximately 8:00 PM Bangladesh time. Federal Reserve Calendar
The market will closely monitor his comments regarding:
• Persistent inflation
• The future path of interest rates
• Financial stability
• Treasury-market conditions
• The balance between inflation control and economic growth
A hawkish speech could support DXY and pressure gold. A cautious or less hawkish message could extend dollar weakness and strengthen the bullish gold narrative.
Gold Technical Map for Next Week
Major Resistance Areas
• $4,632: Recent three-month high
• $4,700: Next major psychological and technical test
A confirmed candle close above the recent high, followed by successful acceptance or a retest, could open the way toward $4,700.
A temporary wick above resistance without follow-through should be treated cautiously because the market may attempt to collect liquidity before reversing.
Major Support Areas
• $4,600: Immediate psychological support
• $4,513: Approximate 200-day moving average and major breakout reference
• $4,500: Major psychological support
The exact value of the 200-day average will change slightly as new candles are added.
Holding above $4,600 would indicate that buyers remain aggressive. A controlled correction toward the breakout structure could still preserve the bullish trend.
A sustained close below the $4,513–$4,500 area would weaken the current bullish structure and increase the probability of a deeper correction.
Three Possible Scenarios
Scenario 1: Bullish Continuation
Gold holds above $4,600, breaks the recent high near $4,632, and gains acceptance above the breakout area.
This scenario becomes stronger if:
• DXY remains weak or falls below its current region
• PCE inflation is softer than expected
• The Federal Reserve avoids a strongly hawkish message
• Geopolitical tensions remain elevated
• Oil stays firm without causing a sharp rise in yields
Under these conditions, gold could challenge the $4,700 region.
Scenario 2: Consolidation and Liquidity Collection
After gaining more than 5% in one week, gold may consolidate or produce a deeper pullback before attempting another continuation.
Price could move between support and resistance, creating false breakouts on both sides. This would be a normal development after such an aggressive rally.
In this environment, traders should avoid entering in the middle of the range and wait for either:
• A confirmed breakout and retest
• A clear rejection from a major level
• A structured pullback with candle confirmation
Scenario 3: Bearish Correction
Gold fails to hold above $4,600 and falls back toward the 200-day moving average.
This scenario becomes more likely if:
• PCE inflation exceeds expectations
• The Fed delivers a strongly hawkish message
• DXY rebounds sharply
• Treasury yields rise
• U.S.–Iran tensions de-escalate
• Oil prices fall as supply concerns ease
A confirmed break below the $4,513–$4,500 structure would suggest that the latest upside breakout is losing strength.
ASURLABS Weekly Bias
Primary bias: Conditionally bullish
The combination of a weak dollar, technical breakout, fiscal uncertainty and geopolitical risk continues to support gold.
However, the market has already moved aggressively. Gold’s bullish structure does not mean every intraday pullback should be bought immediately.
The higher-quality approach may be to wait for:
• A pullback toward support
• A confirmed candle close
• A successful retest
• DXY confirmation
• Alignment with the higher-timeframe structure
The most important confirmation next week will not come from gold alone. Traders should monitor Gold, DXY, Treasury yields, and oil together.
Simple Intermarket Guide
• Gold up + DXY down: Strongest bullish combination
• Gold up + oil up + DXY weak: Safe-haven and inflation-hedge demand
• Oil up + yields up + DXY up: Mixed or potentially bearish for gold
• DXY reversal from support: Warning for gold buyers
• Gold above resistance without follow-through: Possible fakeout
• Geopolitical de-escalation: Possible removal of some safe-haven premium
Final View
Gold remains technically and fundamentally supported, but next week is unlikely to be a simple one-direction market.
The most probable path is continued bullish pressure combined with sharp pullbacks, profit-taking and news-driven volatility.
The key question is not simply whether gold is bullish. The key question is whether buyers can maintain acceptance above the recent breakout while the market processes U.S. inflation data, Jackson Hole communication, Treasury-market stress and geopolitical risk.
Do not chase the rally. Let price confirm the next move.
Market information is based on data available as of August 21–22, 2026. Technical levels may vary slightly by broker and data feed. This analysis is for educational purposes only and does not constitute financial or investment advice.
#ASURLABS #GoldAnalysis #XAUUSD #GoldForecast #DXY #CrudeOil #ForexAnalysis #TechnicalAnalysis #FundamentalAnalysis #RiskManagement
Log in to leave a verified review. Likes and sharing remain public.