
XAUUSD Weekly Outlook: How to Read Key Levels Like a Pro
By UMH · Published 31 July 2026 · Updated 31 July 2026 · 3 min read
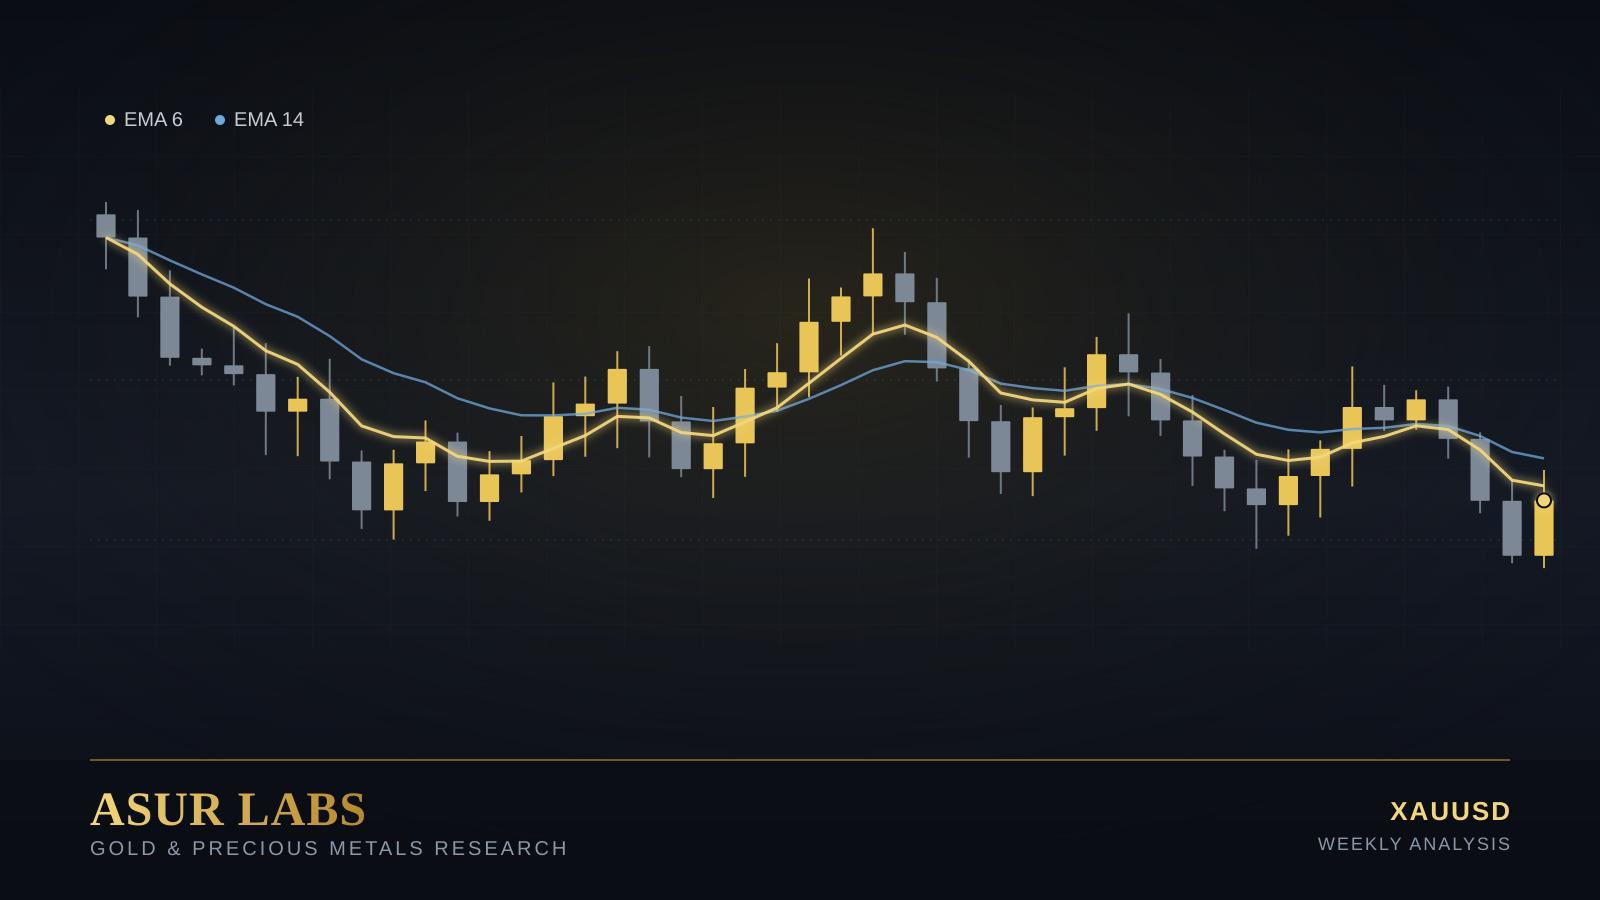
XAUUSD Weekly Outlook: How to Read Key Levels Like a Pro
A practical framework for structuring your weekly gold bias before the market opens
Why the Weekly Read Matters
Gold rarely moves in a straight line. Within a single week, XAUUSD can swing through several distinct phases — a quiet Asian session, a volatile London open, and a news-driven New York close. Traders who react to every candle without a weekly framework end up trading noise instead of structure.
A weekly outlook is not a prediction of exact price levels. It is a map. It tells you where the market is likely to respect structure, where liquidity is resting, and which scenarios you should be prepared for — bullish continuation, bearish reversal, or range-bound consolidation.
The Three Pillars of a Gold Weekly Read
Every solid weekly outlook rests on three pillars that reinforce each other. Skipping any one of them turns analysis into guesswork.
• Higher Timeframe (HTF) Bias — Establish direction on the Daily and 4H charts before zooming into anything lower. If price is making higher highs and higher lows on the Daily, your intraday bias should lean with that structure, not against it.
• Key Support and Resistance Zones — Mark the previous week's high and low, untested order blocks, and round psychological numbers. These are the zones where reactions are most likely to occur.
• Macro Catalysts on the Calendar — Identify the week's high-impact events: US CPI, NFP, FOMC statements, and Treasury yield moves. Gold is exceptionally sensitive to real yields and dollar strength.
Reading Support and Resistance on XAUUSD
Gold respects structure more consistently than many retail traders assume. Look for zones where price has reversed at least twice historically — these are your primary levels. Secondary levels come from Fibonacci retracements drawn on the most recent significant swing, particularly the 50% and 61.8% zones.
Combine this with ADX readings above 25 to confirm that a trend has enough strength to reach the next structural level, rather than stalling midway. A flat or falling ADX below 20 is often a warning sign that the market is entering consolidation rather than trending.
Macro Drivers That Move Gold Weekly
Gold's weekly character is shaped heavily by the US Dollar Index (DXY) and real yields. When yields fall while inflation expectations stay elevated, gold tends to attract flows as a hedge. Conversely, a hawkish Fed narrative and rising yields typically pressure gold lower, even when geopolitical risk is present.
Geopolitical headlines can override technical structure temporarily, but these moves are often mean-reverting once the initial shock fades. The disciplined approach is to note the reaction, but wait for structure to confirm before adjusting your core bias.
Building Your Weekly Trade Bias
Once you have HTF bias, key levels, and the macro calendar mapped out, write down three scenarios before the week begins: your primary bias, an alternate scenario if price breaks structure, and the invalidation point that tells you your read was wrong. This simple habit — used consistently across the SDYKA 9/15 EMA Scalping, SIDDHIVINAYAKA 30 EMA, and SDYKA Signal systems — keeps decision-making objective instead of reactive.
The Asur Labs Approach: We don't sell signals — we build confident traders. Every weekly gold read we publish is designed to teach the framework, not just hand over a price target.
0 comments
Public reading. Respectful participation is available to eligible signed-in members.
Sign in with an eligible membership to comment. Likes and sharing remain public.
Log in to leave a verified review. Likes and sharing remain public.